Split Fiction
Released: 06/03/2025
Developer
Hazelight Studios
Publisher
Electronic Arts
Description
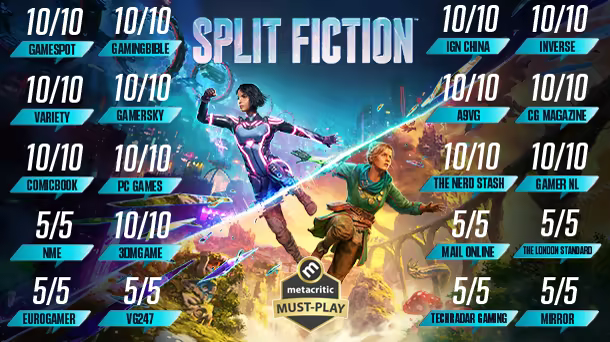
CRITICALLY ACCLAIMED
About the Game
Embrace mind-blowing moments as you’re pulled deep into the many worlds of Split Fiction, a boundary-pushing co-op action adventure from the studio behind 2021 Game of the Year Winner, It Takes Two. Mio and Zoe are contrasting writers – one writes sci-fi and the other writes fantasy – who become trapped in their own stories after being hooked up to a machine designed to steal their creative ideas. They’ll have to rely on each other to break free with their memories in-tact, working together to master a variety of abilities and overcome diverse challenges while jumping between sci-fi and fantasy worlds in this unexpected tale of friendship.Split Fiction is a unique action-adventure experience that keeps you on the edge of your couch with unexpected moments. One minute you’re taming adorable dragons and the next you’re fighting as cyber ninjas, escaping terrifying trolls, or dodging hover cars thrown by a robotic parking attendant. It’s weird, it’s wild, and it’s designed to be shared.
Grab your co-op partner and get ready to overcome any obstacle thrown your way.
Price
$49.99
Followers
203,390
Updated 11/01/2026 19:07
Reviews
97% positive out of 68,355
Updated 11/01/2026 15:23
Metacritic
No data
Copies sold
6.0M
Revenue
$230.6M
Twitch
607 viewers
Updated 11/01/2026 18:30
Highest ranking achieved on 09/03/2025
Top Sellers Ranking
What this shows: Steam's top sellers ranking is updated hourly based on revenue, not unit sales. A game consistently in the top 20 demonstrates strong commercial performance. Look for sustained periods in high positions (green zones) which indicate stable revenue generation. Sharp drops often correlate with the end of promotional sales or the launch of competing titles. Investors should note that top 10 placements typically have significant impact on quarterly earnings, especially for mid-sized publishers.
Reviews History
What this shows: Review accumulation over time reveals player sentiment and community reception. The line tracks total review count growth—steep increases indicate viral moments or major updates. The colored bars show daily review breakdown: green (positive) vs. red (negative). Watch for sudden red spikes, which often signal controversies, technical issues, or unpopular changes. Sustained green dominance (70%+ positive) correlates with long-term sales success. For investors, review velocity matters—games maintaining 1,000+ reviews per month show healthy engagement. Compare review ratios to Metacritic scores to spot discrepancies between critic and player reception.
Followers History
Compare in GDI BenchmarkWhat this shows: Follower count tracks ongoing community engagement over time. Unlike wishlists (which reflect purchase intent), followers indicate sustained interest and active monitoring. Rapid growth spikes often correlate with viral moments, major updates, or positive press coverage. For released games, continued follower growth suggests healthy long-term engagement, which supports DLC sales and live-service revenue. For unreleased games, steady upward trajectory indicates building hype. Compare the slope of this line to similar titles—steeper growth rates predict stronger commercial performance. Use the comparison feature to benchmark against up to 4 genre competitors simultaneously for comprehensive competitive analysis.
Compare with other games: Select up to 4 games to overlay their follower growth patterns around release date (±90 days). This helps identify similar launch trajectories and benchmark performance.
What this shows: Recent follower momentum across different time periods. Positive growth indicates increasing community interest and can signal upcoming catalysts like announcements, updates, or viral moments. Compare short-term (24h, 3D) vs long-term (14D, 30D) trends to identify acceleration or deceleration in community growth. Sudden spikes often precede or follow major news events.
Player Statistics
What this shows: Concurrent player counts (CCU) and daily active users reveal real-time engagement with the game. High sustained CCU indicates healthy player retention, which drives ongoing revenue through in-game purchases, DLC, and premium subscriptions. Look for the 24-hour peak—multiplayer games should show clear patterns (evening spikes in major regions). Single-player titles typically see declining CCU over weeks unless major updates or discounts occur. For investors, sustained player counts months after launch signal successful live-service implementation. Sharp drops may indicate server issues, negative publicity, or loss of interest. This data complements revenue estimates—games with 100,000+ daily players usually generate significant recurring income.
Top Wishlist Ranking
What this shows: Wishlist rankings indicate pre-launch demand and commercial potential. Games climbing this chart (lower numbers = better) demonstrate growing anticipation. A top 20 wishlist position typically predicts strong launch-day sales. Watch for acceleration in the final 4-8 weeks before release—games maintaining momentum often exceed revenue expectations. For investors, wishlist trends can signal which upcoming titles will drive next quarter's performance. Sudden ranking improvements often follow major announcements, gameplay reveals, or beta access periods.
Search Interest
What this shows: Google Search trends reveal public awareness and interest over time, independent of Steam metrics. Spikes indicate moments when the game captured mainstream attention—typically around announcements, trailers, beta releases, or launch day. Compare search interest to follower growth to gauge whether marketing efforts are reaching beyond the existing gaming community. For unreleased games, rising search volume suggests effective promotional campaigns. For released games, sustained search interest months after launch indicates lasting cultural relevance. Investors should note: viral search moments don't always translate to sales, but they do indicate brand awareness that could drive future DLC or sequel success. This data helps answer "Is anyone talking about this game outside of core gaming circles?"
Loading search interest data...